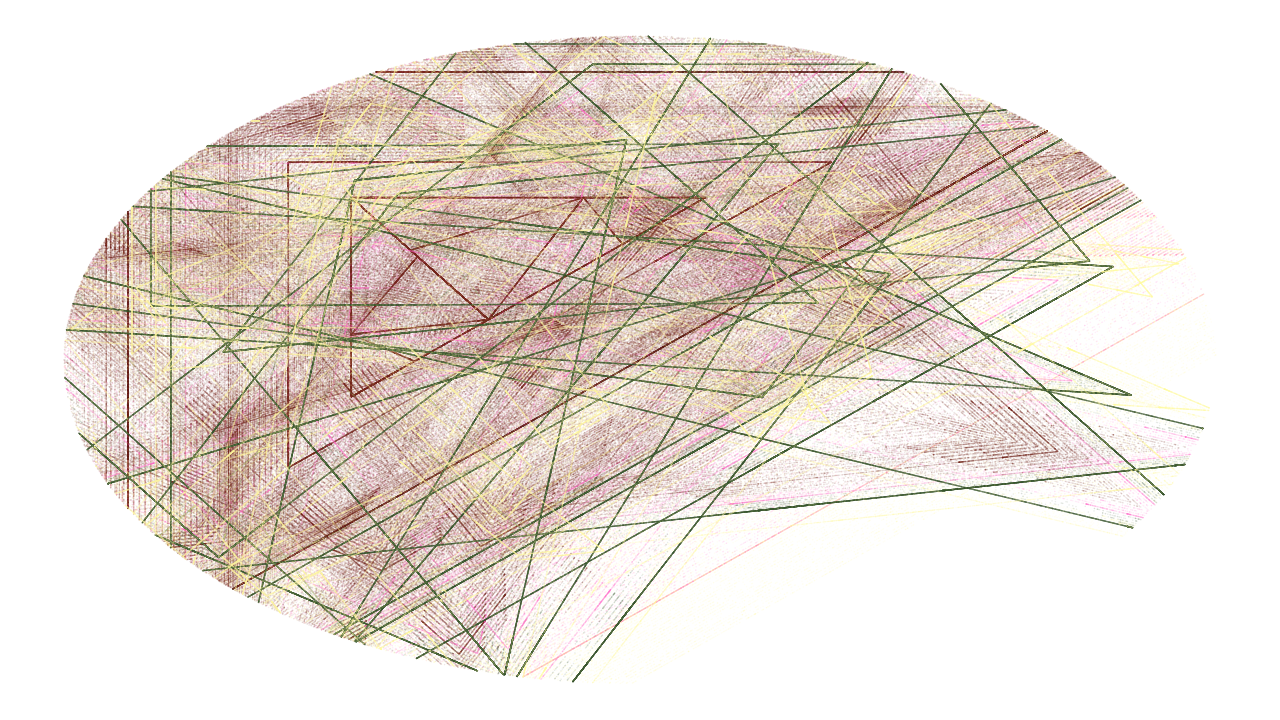
Introduction
Hello, my name is Stevan Dedovic. This tutorial, and a companion video, was made for Creative Computing Hub Oslo. They requested everything be published to the public domain.
Except where otherwise noted, this work is licensed under CC-BY: https://creativecommons.org/licenses/by/3.0
—
For some background, around 2018 I visited the Metropolitan museum in New York. They had an exhibit on Abstractionism, and the Geometric Abstraction pieces really stood out to me. Then shortly after, I hosted an art show in Chicago and I needed to present some new work. The following pieces can be found on my website, dedovic.com, and recreating them is our goal today.
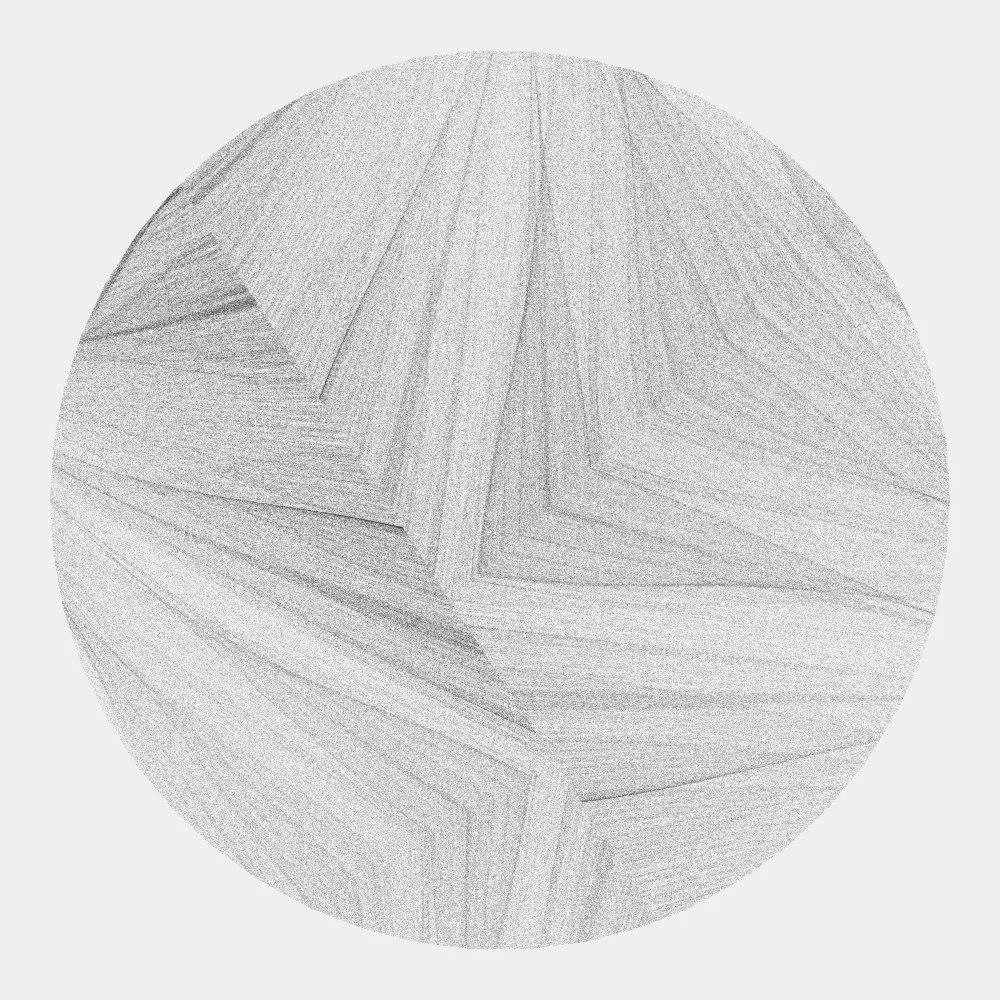
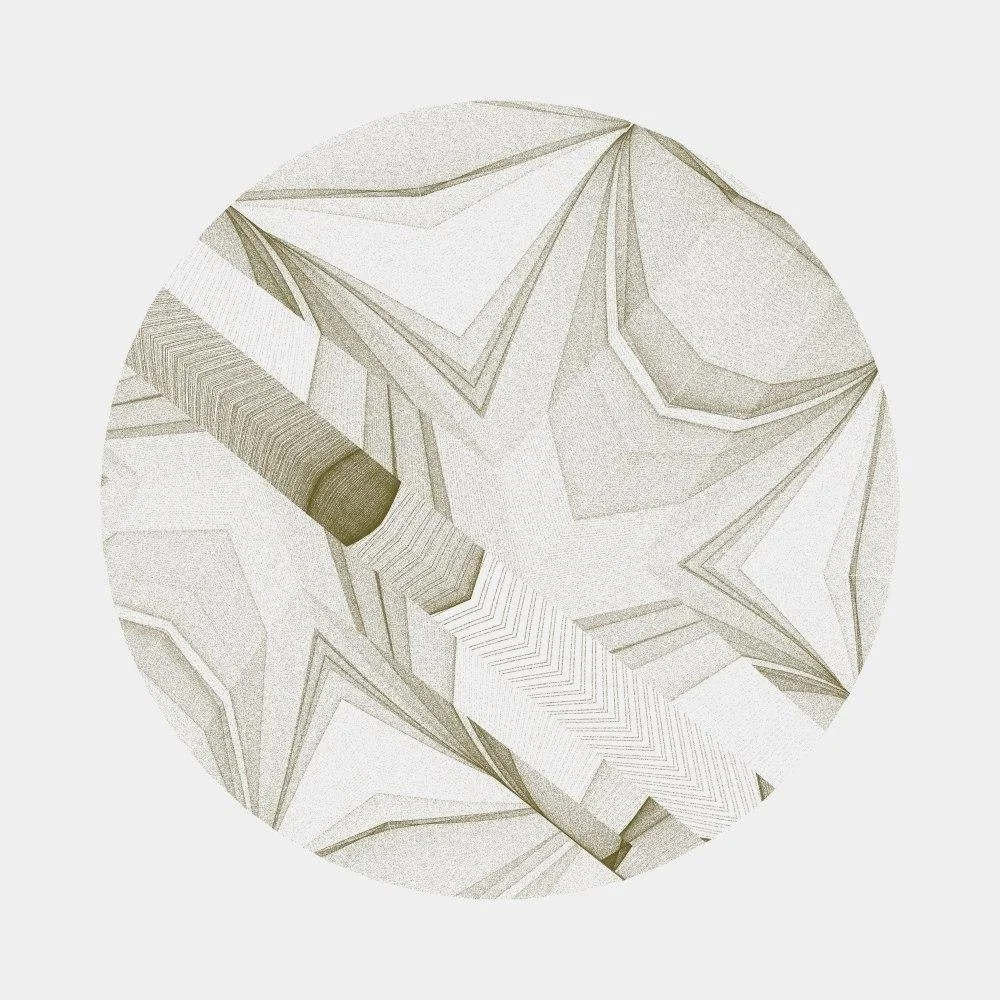
This writeup is somewhere between a tutorial and explanation, and it will follow my creative process. It is intended for readers who know some Javascript and maybe p5.js.
P5 Setup
First, let’s set up an environment with useful functions and defaults.
This will set the color mode to HSB (also known as HSV), which is a little more intuitive than the RGB color space.
function setup() {
  colorMode(HSB, 360, 100, 100, 1.0);
}

function draw() {}
Next, let’s make the draw function to clear the background and draw a simple triangle on screen. We also need to create a canvas.
function setup() {
  colorMode(HSB, 360, 100, 100, 1.0);

  // 400px x 400px nearly fills the screen on my laptop
  createCanvas(400, 400);
}

function draw() {
  // 0 saturation and 100 brightness means a white background
  background(0, 0, 100);

  // 0 brightness means a black stroke line
  stroke(0, 0, 0);

  // small triangle
  triangle(10, 10, 50, 50, 50, 10);
}
Already, there is a problem. The size of the canvas and the coordinates of the triangle are defined in pixels. This means that scaling the drawing later will be problematic, for example if we want a high DPI version for printing or publishing . This can be solved quite easily, though, by avoiding pixel coordinates in the first place, with some helper functions.
/** Convert normalised value [0, 1] to canvas coordinate [0, WIDTH] */
function w(val) {
  return val * width;
}

/** Convert normalised value [0, 1] to canvas coordinate [0, HEIGHT] */
function h(val) {
  return val * height;
}

...

function draw() {
  background(0, 0, 100);
  stroke(0, 0, 0);

  // this is necessary to scale the thickness of the stroke
  //  with the size of the canvas. The value is approximate,
  //  and looks consistent with the 1px line from before.
  strokeWeight(w(0.003));

  // draw triangle using coordinates relative to the canvas
  triangle(w(0.1), h(0.1), w(0.9), h(0.9), w(0.9), h(0.1));
}
Now, the canvas size can be changed but the drawing remains consistent. Try it out.
Note: It’s worth defining our data types ahead of time.
- in javascript, number types may be either integer or decimal (floating point) numbers, so the distinction is not necessary
- a point is a 2-list of numbers, e.g.
[0, 0]or[3.1, 9.2] - a triangle is a 3-list of points, e.g.
[[0, 0], [1, 0], [1, 1]]
Triangle Subdivision
This is the first of a handful of patterns in the generative artists toolbox I will cover today. There are many algorithms and off-the-shelf libraries to perform triangle subdivision, but we will write our own.
Let’s define “triangle subdivision” as a function that takes a triangle, cuts it in half, and outputs a list of the two smaller halves. Additionally, subdivision should look pleasing. This means creating nicely spaced triangles by subdividing the longest side of the triangle. Finally, it needs to be a little random and allow us to tweak how random . The high-level algorithm is as follows:
- Find the lengths of all the sides of the triangle
- Find the longest side
- Select a point
malong the longest side, close to the middle - Split the triangle into two
Here is that, as code:
/** Calculates the equality between two floats. */
function equalf(a, b) {
    return Math.abs(a - b) < Number.EPSILON;
}

/** Subdivides a triangle. Returns a list of triangles. */
function subdivide(tri) {
  // destructure the individual coordinates
  const [[ax, ay], [bx, by], [cx, cy]] = tri;

  // Step 1 - find lengths of sides
  const lenAB = dist(ax, ay, bx, by);
  const lenBC = dist(bx, by, cx, cy);
  const lenCA = dist(cx, cy, ax, ay);

  // Step 2 - determine longest side
  const longest = Math.max(lenAB, lenBC, lenCA);

  // Helper Function
  // Subdivide the traingle ABC along the side AB.
  // Picks a point random, but close to the midpoint of AB.
  const subdivideAB = (a, b, c) => {
    const [ax, ay] = a;
    const [bx, by] = b;

    // Step 3 - select random point close to midpoint
    const n = randomGaussian(0, 0.09);
    const xm = lerp(ax, bx, 0.5 + n);
    const ym = lerp(ay, by, 0.5 + n);
    const p = [xm, ym];

    // Step 4 - create two new triangles, splitting side AB
    return [
        [p, a, c],
        [p, b, c]
    ];
  };

  // Step 3 - subdivide the longest side
  const [a, b, c] = tri;
  if (equalf(lenAB, longest))
    return subdivideAB(a, b, c);
  if (equalf(lenBC, longest))
    return subdivideAB(b, c, a);
  if (equalf(lenCA, longest))
    return subdivideAB(c, a, b);
}
I’ll explain a few decisions in the next sections, feel free to skip this section if you don’t need an in-depth explanation. But first, to use the above function, we must change draw a bit:
// pull our initial triangle out of the draw function
const defaultTri = [[0.1, 0.1], [0.9, 0.9], [0.9, 0.1]];

function draw() {
  background(0, 0, 100);
  stroke(0, 0, 0);
  strokeWeight(w(0.003));

  // since subdivide returns a list of triangles, we must iterate over them
  for(tri of subdivide(defaultTri)) {
    const [[x1, y1], [x2, y2], [x3, y3]] = tri;
    triangle(w(x1), h(y1), w(x2), h(y2), w(x3), h(y3));
  }
}
If you’re interested in exploring triangle subdivision further, I recommend checking out this 2017 article by artist Tyler Hobbs.
float equality
Floating point numbers can be tricky when it comes to ordering and equality. They have finite precision, which means some number, like 1/3, cannot be represented without information loss. This topic is well covered on the internet. Equality between floats must be treated with care. Above, I’ve defined a helper function, equalf, that compares two floats and returns if they are close enough to be considered equal. This isn’t strictly necessary, but I err towards caution. It’s usually better to write a bit more code than deal with weird float precision bugs. Also, check out the documentation for the Javascript Math.EPSILON for more info.
Note - Julia Evan’s “wizard zines” has an amazingly fun and informative zine, titled “How Integers and Floats Work” and I cannot recommend it enough!
lerp
I used the lerp or linear interpolation function above, to select a midpoint between two values. If you’re not familiar, it returns the value of interpolating from the first parameter to the second parameter by an amount from 0 to 1. I like using lerp as it is very flexible and performant.
randomGaussian
Using randomGaussian lets us randomize the location of the midpoint, along the side AB. But, unlike the random function, the selected value is not uniformly selected; with a Gaussian distribution values near the mean are more likely than values far away from the mean. The randomGaussian function in P5js takes in two parameters - the mean and standard deviation . The way its used in conjunction with lerp in the above code effectively becomes , “select a point randomly but likely close to the midpoint of the line”.
Interaction
Next on our journey is to set up some live interaction. We’ll start small - I want to subdivide the initial triangle whenever I hit the s key on the keyboard. P5js has a very easy way to do this - the keyPressed function. This is similar to setup and draw in that it is defined by us and then the P5 runtime executes it.
In order to subdivide the triangle, we have to do some state management. Currently, the draw function is where subdivide is called, and that means it is called once per render. Instead, we want to store a list of all the triangles to draw, and:
- update by subdividing when the key
sis pressed - iterate over the triangles when rendering in the
drawfunction
Lets start by externalizing the triangles we plan to render:
// keep the default as it is useful
const defaultTri = [[0.1, 0.1], [0.9, 0.9], [0.9, 0.1]];

// this is our list of triangles to draw.
// Note the `let` instead of `const` - this is necessary as we will reassign the value when subdividing.
let toDraw = [defaultTri];

function draw() {
  background(0, 0, 100);
  stroke(0, 0, 0);
  strokeWeight(w(0.003));

  // this will _not_ perform subdivision
  for(tri of toDraw) {
    const [[x1, y1], [x2, y2], [x3, y3]] = tri;
    triangle(w(x1), h(y1), w(x2), h(y2), w(x3), h(y3));
  }
}
Running the above code will simply render the default triangle. Nothing new yet, so lets implement the keyPressed function.
// called by P5js whenever a key is pressed.
// See P5 docs for semantics and comparison with other key interaction functions

function keyPressed() {
    if (key === 's') {
        toDraw = toDraw.flatMap(subdivide);
    }
}
This function is quite simple - when the s key is pressed, it reassigns the value of toDraw by subdividing each triangle in toDraw. The flatMap function is akin to performing a map and then concatenating the results.
So now, running this all together, we get an interactive little app. Try changing the the stroke weight, second parameter of randomGaussian, or the defaultTri. Notice, also, how long it takes to subdivide - the performance can be quite bad at 5+ iterations. It can also completely crash your browser, so beware!
Offsetting
Next up, I want to shrink all the triangles. This is called offsetting, and for triangles is simple enough. We can offset a triangle by finding the center and moving each vertex slightly inwards. While triangles have multiple centers, I will use the centroid, due to personal preference and the simplicity of the centroid algorithm.
// Offsets or insets the triangle by the specified
//  amount. Positive values shrink, negative values grow.
function offset(tri, amount) {
    const [[x1, y1], [x2, y2], [x3, y3]] = tri;

    // calculate centroid coordinates
    const cx = (x1 + x2 + x3) / 3;
    const cy = (y1 + y2 + y3) / 3;

    const moveToward = (px, py, tx, ty) => {
      // atan2 gives us the angle between two points
      const theta = atan2(ty - py, tx - px);
      return [
        px + amount * cos(theta),
        py + amount * sin(theta)
      ];
    };

    return [
        moveToward(x1, y1, cx, cy),
        moveToward(x2, y2, cx, cy),
        moveToward(x3, y3, cx, cy),
    ];
}
And wiring up the offsetting algorithm to our keyboard input handling:
function keyPressed() {
    ...

    if (key === 'j') {
        toDraw = toDraw.map(tri => offset(tri, 0.01));
    }
    if (key === 'k') {
        toDraw = toDraw.map(tri => offset(tri, -0.01));
    }
}
Now you can rerun the app and play around with subdividing, growing, and shrinking all the triangles. But there’s a few small issues that can be improved.
Holding Down a Button
First, instead of using keyPressed, we can move the offsetting to happen in draw, using the keyIsDown function. This means we handle holding not pressing to change the shape.
function draw() {
  // setup code
  ...


  if (keyIsDown(74)) { // "j"
    toDraw = toDraw.map(tri => offset(tri, 0.005));
  }
  if (keyIsDown(75)) { // "k"
    toDraw = toDraw.map(tri => offset(tri, -0.005));
  }

  // drawing code
  ...
}
Two things to note:
keyIsDownworks on key codes, not a character. The P5js docs reference this site to lookup key codes. It’s worth noting they are case-sensitive.- because
drawis called for each frame, I lowered the offset strength to0.002.
Fixing the Offsetting
One thing you may notice is that the offsetting algorithm is distorting the shape of the triangle as it works. This is because we need to move the points of the triangle proportionately, relative to their distance from the centroid.
The way this can be done is by linearly scaling the amount of offsetting based on how far each point is from the centroid, and using the longest distance as the baseline amount. In code, this means modifying the offset function as follows,
function offset(tri, amount) {
  ...

  // longest distance from triangle point to centroid -
  //   this is the baseline
  const lenLongest = Math.max(
    dist(x1, y1, cx, cy),
    dist(x2, y2, cx, cy),
    dist(x3, y3, cx, cy)
  );

  const moveToward = (px, py, tx, ty) => {
    const theta = atan2(ty - py, tx - px);

    // figure out scaling factor based on length from this
    //  triangle point to centroid and baseline
    const len = dist(px, py, tx, ty);
    const scaleFactor = len / lenLongest;

    // now scale the offsetting amount by the above factor
    return [
      px + amount * scaleFactor * cos(theta),
      py + amount * scaleFactor * sin(theta)
    ];
  };

  ...
}
Now that is much better! There are probably better algorithms to do this, but I like this approach as it lets me tweak some of these values later so I can change the behavior of the offsetting in a unique way.
Turning off the Background Redraw
One of my favorite tricks is to disable redrawing the background of an interactive artwork. Removing fill and lowering the stroke opacity is also a good idea.
function draw() {
  // commented out now
  // background(0, 0, 100);

  noFill();
  stroke(0, 0, 0, 0.05);

  ...
}
Interactions, Pt. 2
I’m going to take a quick detour and improve the overall experience of the sketch. It’s going to make it a better overall tool.
Toggling Drawing
First up is toggling the drawing of the triangles and turning it off by default.
// optionally set this to true so that is draws by default
let shouldDraw = false;

function keyPressed() {
  ...


  if (key === 'd') {
    shouldDraw = !shouldDraw;
  }
}

function draw() {
  ...

  if (shouldDraw) {
    for(tri of toDraw) {
      const [[x1, y1], [x2, y2], [x3, y3]] = tri;
      triangle(w(x1), h(y1), w(x2), h(y2), w(x3), h(y3));
    }
  }

  ...
}
Note: since only the drawing part of the draw function is conditional, we will always subdivide, grow, shrink the triangles. None of the interactions are affected.
Resetting
This one is pretty simple. When I hit r, I want the whole sketch to reset. That means resetting to the default triangle, disabling drawing, and clearing out the canvas. Here it is:
function keyPressed() {
  ...


  // reset key
  if (key === 'r') {
    shouldDraw = false;
    toDraw = [defaultTri];
    background(0, 0, 100);
  }
}
Sand Painting
I’ll quote the Anders Hoff / Inconvergent article, Grains of Sand, to explain the concept:
Basically it works by drawing several, almost transparent, dots at random along a line. This is akin to spreading a fixed number of grains of sand along a line—hence the name. If you always use the same number of grains, this will have the effect of making the line appear dense whenever the points are close to each other. And, conversely, less dense when they are farther apart.
I love using this as a “drawing” technique, viewing it as an emulated digital medium.
Basic Algorithm
The algorithm is quite simple: given a number of grains, n, randomly place them along the line AB. To start, we will place the grains uniformly randomly, and along the edges of the triangles we are already drawing. The trick is keeping the lines a consistent density, i.e. adding more grains if the line is longer.
function paintLine(a, b) {
  const [x1, y1] = a;
  const [x2, y2] = b;
  const len = dist(x1, y1, x2, y2);

  // density might need to be tweaked to look pleasant
  const density = 500;
  for (let i = 0; i < len * density; i++) {

    // random number [0, 1]
    const r = random();

    const xr = lerp(x1, x2, r);
    const yr = lerp(y1, y2, r);
    point(w(xr), h(yr))
  }
}
Domain Warping
To give it some more character, we’ll employ a technique called domain warping. This technique boils down to mapping the inputs of the grain positioning through a noise function. There is a wonderful article by Inigo Quilez, domain warping, that covers the concept well.
function paintLine(a, b) {
  ...

  const rez = 0.01
  for (let i = 0; i < len * density; i++) {

    // because `noise` is nonuniform and continuous,
    //  we get a really visually pleasing effect
    const r = random();
    const n = noise(x1 * rez, y1 * rez, r);

    const xr = lerp(x1, x2, n);
    const yr = lerp(y1, y2, n);

    point(w(xr), h(yr))
  }
}
I’m using the noise function in P5js, which I will not cover in depth here. There are many other articles that cover gradient noise elsewhere.
One small issue with the noise function is the output range - it returns values from [-1, 1] whereas lerp takes in values from [0, 1]. This can be solved a number of ways, but for now I’ll simply scale it up a bit and make it “wrap”. Unfortunately, Javascript does not have a built-in function to do this, so we’ll reimplement the fmod function from C.
function fmod(n, d) {
    return n - (Math.floor(n / d) * d);
}

function paintLine(a, b) {
  ...

  const rez = 0.01
  for (let i = 0; i < len * density; i++) {

    const r = random();
    let n = noise(x1 * rez, y1 * rez, r, frameCount);

    // scale by 10 and only keep the fractional part
    n = fmod(n * 10, 1.0);

    const xr = lerp(x1, x2, n);
    const yr = lerp(y1, y2, n);

    point(w(xr), h(yr))
  }
}
Interactions and Change
A few further ideas, I leave up to the reader.
- Pull the
rezvariable out to a global, and use some new keys (e.g.h,l) to decrease and increase the value , respectively. - Tweak the
n = fmod(...)call. Maybe by scaling the inputs a bit. - add a third parameter to the
noisefunction call, maybe based onframeCount?
Finishing Up
The sketch is coming together really well. There’s only a few small things that I need to add before it’s a faithful recreation of the original works.
Color
I like the interactivity of the rest of the sketch, so color selection will be interactive as well. Colors can be defined as a list of HSV values, and selected by hitting the number keys. A clever way to handle key inputs is to use keyCode again, knowing that the numbers 0-9 on the keyboard have incrementing keyCode values.
const colorPalette = [
    [47, 35, 92],
    [33, 100, 100],
    [276, 16, 80],
];

// default color is black
let currentColor = [0, 0, 0];

function setup() {
  ...

  // this was moved out of draw
  stroke(0, 0, 0, 0.05);
}

function keyPressed() {
  ...

  // "0"
  if (keyCode == 48) {
    stroke(0, 0, 0, 0.05)
  }

  // "1"-"9"
  if (keyCode >= 49 && keyCode <= 57) {
    const idx = min(keyCode - 49, colorPalette.length - 1);
    const currentColor = [...colorPalette[idx], 0.05];
    stroke.apply(null, currentColor);
  }
}
It’s worth noting - the actual color values are not mine. I stole them from a book I purchased a while ago, A Dictionary of Color Combinations.
Masking
Masking is a simple concept. I want to isolate sections of the image from drawing. One option is to use multiple p5.Graphicsrenderers, which can be thought of as Layers in GIMP/Photoshop/similar photo editing software. Another option is to perform the masking work ourselves in the draw function. I originally took the approach of doing it myself because in a high resolution print the little “grain” placed during sand painting can be visible, and possibly span more than one pixel. I don’t want to crop my graphic, I want to simple omit drawing a grain. Unfortunately, this isn’t very performant.
For a simple circle, calculating whether a point is inside or outside is done by making sure the distance between our point and the center of the circle is smaller than the radius of the circle. Here’s the code:
function testInCircle(testPoint, circleCenter, circleRadius) {
    const [px, py] = testPoint;
    const [cx, cy] = circleCenter;

    return dist(px, py, cx, cy) < circleRadius;
}
Now adding that to the drawing function lets us clip the drawn triangle.
function paintLine(a, b) {
  ...

  // point in center with a diameter of 0.8
  if (testInCircle([xr, yr], [0.5, 0.5], 0.4)) {
    point(w(xr), h(yr))
  }

  ...
}
There are ways to do more complex shapes, and I’ll direct the reader to SDFs, or Signed Distance Functions. Here is another Inigo Quilez article that demonstrates some 2D SDF examples with code. Unfortunately, a general solution to the Point-In-Polygon problem is not so simple, and out of the scope of this tutorial.
Fin
While there is a lot more that can be done, I need to wrap things up. One thing I’ve purposely left out is a small helper function to randomize the starting triangle. I leave this up to the reader, but I include it in my final sketch. If you need a hint - I do it by placing triangle coordinates along a big circle.
I’ll leave a couple ideas and links to further materials by some of my favorite artists and coder.
Taking it Further
- Similar to the previous point, try different shapes than triangles. General polygon triangulation, also known as tessellation, is a huge field and a really fun area to explore.
- Add multiple color palettes. Use the control key + a number to switch between palettes.
- Try other SDFs and combining them using boolean operations
- Try other masking code. For instance, by sampling a bitmap or image
- Take the domain warping one step further by using the current value of
noiseas an input into anothernoisecall - Change the shape of the grains of sand to a square or triangle
References
- https://p5js.org/
- https://www.toptal.com/developers/keycode
- https://www.dedovic.com
- https://sanzo-wada.dmbk.io/
- https://developer.mozilla.org/en-US/docs/Web/JavaScript
Other Artists
- Matt DesLauriers’s blog- especially his Subscapes write-ups
- inconvergent.net - this is likely my biggest source of inspiration
- Jess Hewitt’s website- her writeup on Boundary Issues goes over the process of making the series
- The YouTube channel Generative Garden - while there are only 3 videos, they are wonderful explanations
- Inigo Quilez - so many gems, every time I am here I learn something new
- Ben Kovach - he’s got a lot of great writing, so much amazing art
This… was a long writeup. If you find any inaccuracies or have questions, please feel free to reach out via email, Instagram, or Matrix. You can contact me at stevanproductions@gmail.com
Again thanks so much to Creative Computing Hub Oslo for this opportunity!
© Stevan Dedovic 2024, Some Rights Reserved
Except where otherwise noted, this work is licensed under https://creativecommons.org/licenses/by/4.0/